· QANTERION · Risk Management · 2 min read
How to Evaluate AI Quant Strategies Using Sharpe Ratio and Max Drawdown
Evaluating quant strategies goes beyond annualized returns. Learn how to use Sharpe Ratio and Max Drawdown to spot high-win-rate traps and over-fitting risks.
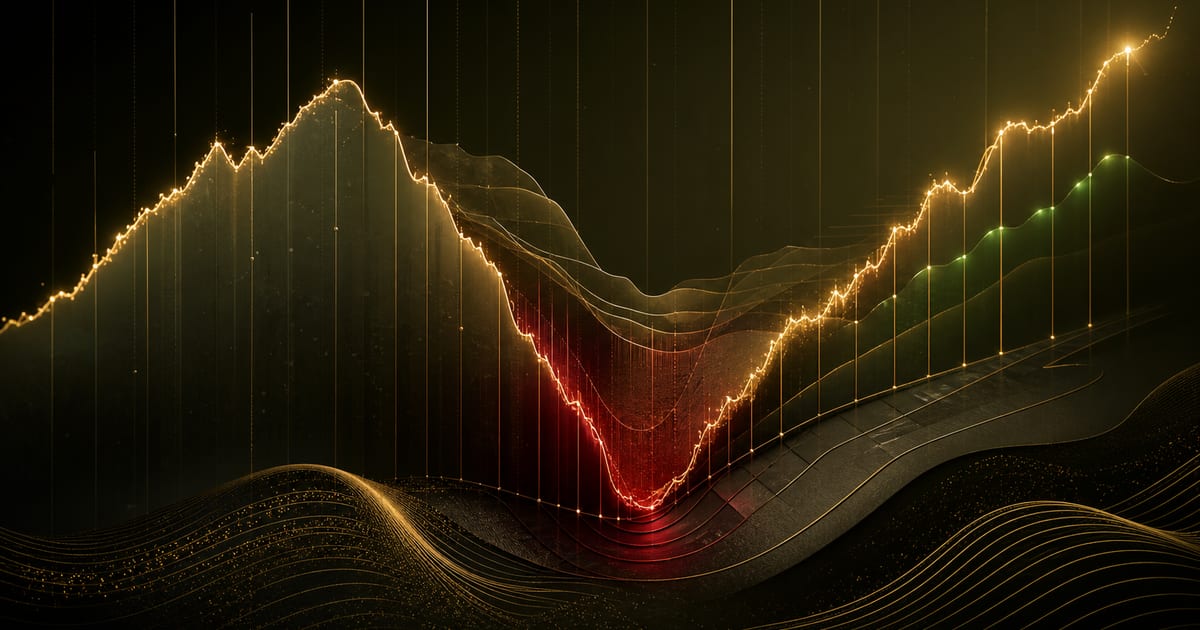
Short answer: A high annualized return does not guarantee a sound trading strategy. Combining the Sharpe Ratio (to measure excess return per unit of volatility) with Max Drawdown (to gauge maximum equity stress) is the standard approach for evaluating AI quant trading strategies.
Why Annualized Return Alone Is Misleading
In quantitative trading, claims of “100% APY” are common. However, if a strategy suffers a 70% peak-to-trough decline or relies on extreme leverage to achieve temporary gains, it carries a high risk of liquidation in real market conditions.
Evaluating a quant strategy requires answering one core question: How much risk was taken to achieve those returns?
Calculating & Understanding the Sharpe Ratio
Developed by Nobel laureate William F. Sharpe, the formula is:
$$ \text{Sharpe Ratio} = \frac{R_p - R_f}{\sigma_p} $$
Where:
- $R_p$: Annualized portfolio return
- $R_f$: Risk-free benchmark rate (e.g., U.S. Treasuries or stablecoin yields)
- $\sigma_p$: Annualized volatility (standard deviation) of strategy returns
How to Interpret Sharpe Ratio Benchmark Ranges:
| Sharpe Ratio Range | Evaluation | Practical Meaning |
|---|---|---|
| < 0 | Subpar / Negative | Underperforms risk-free rates; not suitable for live allocation. |
| 0.5 - 1.0 | Mediocre | High volatility relative to limited excess return. |
| 1.0 - 2.0 | Good | Solid risk-adjusted return profile. |
| > 2.0 | Excellent | Strong excess return (verify out-of-sample data to rule out overfitting). |
|
You can calculate strategy figures instantly with our free Online Sharpe Ratio Calculator.
Max Drawdown & Risk Tolerance Limits
Max Drawdown measures the maximum percentage loss from a portfolio’s peak to its subsequent trough:
$$ \text{Max Drawdown} = \frac{\text{Peak Value} - \text{Trough Value}}{\text{Peak Value}} \times 100% $$
In live trading, Max Drawdown determines:
- Whether the strategy risks triggering exchange liquidation lines;
- Whether drawdown duration exceeds trader risk limits;
- The time required for capital recovery.
Integrating Strategy Analytics: TradingView vs QANTERION
General charting platforms excel at technical indicator visualization but lack multi-account position consolidation and automated risk circuit breakers. For a detailed breakdown, see our QANTERION vs TradingView Analysis.
The QANTERION AI terminal integrates Sharpe Ratio, Calmar Ratio, and real-time Delta exposure into a unified risk workspace, giving traders clear visibility and execution control.
Summary & Further Reading
When evaluating any quantitative strategy, follow this sequence:
- Check Sharpe Ratio: Ensure returns compensate for volatility (target Sharpe > 1.0);
- Check Max Drawdown: Verify worst-case equity decline is within your capital budget;
- Verify Execution Friction: Account for trading fees, slippage, and order latency.
Continue with How to Read Backtest Risk Beyond Returns and review our Risk Disclosure.
- Sharpe Ratio
- Max Drawdown
- AI Quant Strategy
- Risk-Reward Ratio